


Statistics Canada — New Housing Price Index
The The New Housing Price Index (NHPI) rose 0.4% in February compared with the previous month. Ontario accounted for the majority of the gain, as new house prices increased in all 10 of its surveyed metropolitan areas.
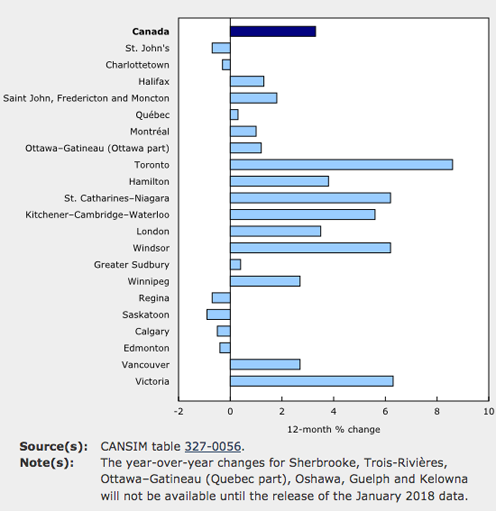
New Housing Price Index, monthly change
New house prices were up in 16 of the 27 metropolitan areas surveyed, with the largest increases observed in Guelph (+1.4%) and Oshawa (+1.2%). Builders in Guelph tied the increases to higher construction costs, a shortage of developed land, and improving market conditions. In Oshawa, builders cited improving market conditions as the primary reason for the rise.
Toronto was the top contributor to the national gain, with prices up 1.0%. Builders reported moving to new phases of land development, a shortage of developed land and improving market conditions as the main reasons for the rise.
Other notable increases (+1.0%) were observed in Hamilton and Victoria. Builders in both areas reported market conditions as the primary reason for the increase. For Hamilton, this was the largest price gain observed since July 2009.
New housing prices fell 0.2% in Calgary. Although some builders reported higher construction costs, these were offset by lower negotiated selling prices and promotions to stimulate sales. Prices in Vancouver were down 0.1% for the second month in a row.


